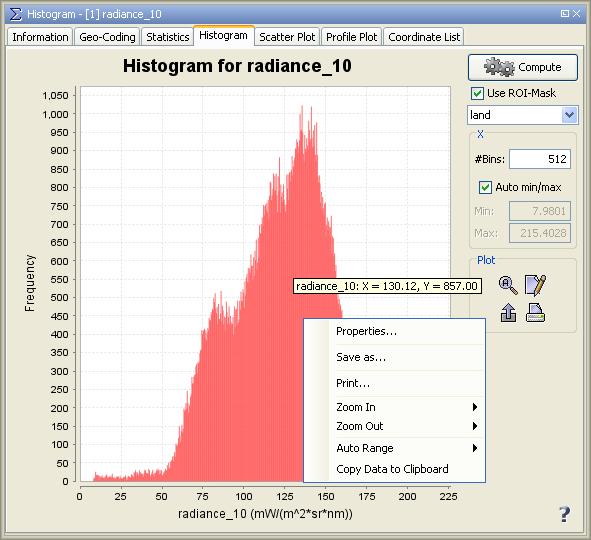
Histogram Display
This dialog displays a histogram for the selected band.
If a ROI is defined, you may restrict the computation to the pixels within that ROI. You can also
set the number of bins used for the histogram creation, and set the range manually or let it
compute automatically.
Context Menu
A click with the right mouse button on the diagram brings up a context menu
which consists of the following menu items:
- Properties...
Edit several properties (colors, axes, etc.) of the diagram.
You can also use the  on the right 'Plot' panel.
- Save As...
Save the diagram as image (PNG).
You can also use the  on the right 'Plot' panel.
- Print...
Print the diagram.
You can also use the  on the right 'Plot' panel.
- Zoom In
- Both Axes - Zoom in on both axes.
You can also use the  on the right 'Plot' panel.
- Domain Axes - Zoom in only on the domain axis.
- Range Axes - Zoom in only on the range axis.
- Zoom Out
- Both Axes - Zoom out on both axes.
You can also use the  on the right 'Plot' panel.
- Domain Axes - Zoom out only on the domain axis.
- Range Axes - Zoom out only on the range axis.
- Auto Range
- Both Axes - Adjusts both axes to the full data range.
You can also use the  on the right 'Plot' panel.
- Domain Axes - Adjusts the domain axis to the full data range.
- Range Axes - Adjusts the range axis to the full data range.
- Copy Data to Clipboard
This will copy the diagram data as tabulated text to the system clipboard.
The copied text can then be pasted directly into a spreadsheet application
(e.g. Microsoft® Excel).