The program was written in IDL.
To
build an RGB image I use the following channels:
I
use the "histogram equalizing" IDL function (Its source code can be
found in the file hist_equal.pro and the theory can be found e.g.
http://www.cee.hw.ac.uk/hipr/html/histeq.html
http://www.khoral.com/contrib/contrib/dip2001/html-dip/c4/s5/front-page.html
).
The HIST_EQUAL function returns a histogram-equalized byte array.
Here is an example for the red channel:
HIST_EQUAL(R, MINV = 20, MAXV = 255, TOP = 255);
Arguments:
- R - The array to be histogram-equalized.
- MAXV - The maximum value to consider.
- MINV - The minimum value to consider.
- TOP - The maximum value of the scaled result.
Afterwards the created image can often be optimised with "Photoshop".
Such
a simple and quick procedure gives rather good results.
Unfortunately, vegetation is conveyed by means of the red color but it allows
one to make out far more details in the structure of the Earth surface compared
with the number of such details in the "real pictures".
It is also possible to make out much more details in the upper layer of the
water surface, which ( as well as in the water flora) and is presented by "correct"
colors of the blue, light-blue, green and yellow.
The particulars of what is going on in the lower atmosphere layer (clouds, aerosols,
the smoke of fires) is also presented in their expected natural colors.
Advantages of the Method:
The Drawbacks of the method.
What can be called a "real" picture?
A picture that looks just as it is seen from the Space and not having pseudo-colors?
However, the views of the Earth objects ( in the sense of color) seen from a
height of 100 km and from the height of 5 km will differ because of the absorbing
influence of the atmosphere. This effect is taken into consideration by means
of the models calculating the atmosphere transmitting function depending on
the geographical situation, season and other important conditions. It is not
possible to exactly depict these conditions, that is why this method does not
give absolutely accurate results.
The images made from planes are different from those we receive from satellites,
both spatially and temporally, therefore the question arises as to what we define
as a correct image - what is a "real image".
Speaking about such pictures we may divide them into three types.
There are graphs "tristimulus or color-matching functions"on page 49 of the monograph Curtis D. Mobley "Light and Water. Radiative Transfer in Natural Waters" [Curtis D. Mobley, Academic Press 1994; ISBN 0-12-502750-8] that show how and in what wave band the colors are distributed in the terms of RGB so that the picture is designed on this basis and corresponds with what the naked eye sees.
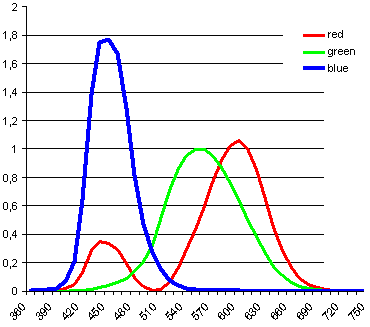
(X-Axis:
Wavelength (nm); Y-Axis: the value of the function)
Taking MERIS for example, we deal with 15 channels distributed as is shown on page http://envisat.esa.int/dataproducts/meris/CNTR3-2-1.htm, we get (with the necessary precision) the following formulae, which enable one to design a "real" picture based on the information that comes from MERIS.
Red
= log(1 + 0.35 * reflectance_2 + 0.6 * reflectance_5 +
reflectance_6 + 0.13 * reflectance_7)
Green = log(1 + 0.2 * reflectance_3
+ 0.5 * reflectance_4 + reflectance_5 + 0.4 * reflectance_6)
Blue = log(1 + 0.2 * reflectance_1
+ 1.75 * reflectance_2 + 0.47 * reflectance_3 + 0.16 * reflectance_4)
Taking the logarithm of the functions outlined enables the smoothing out of the contrasts and the overexposure due to clouds.
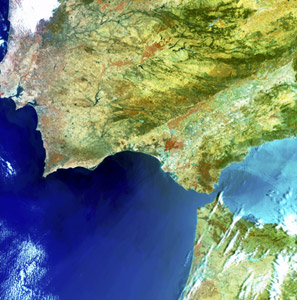
An
example of such a picture from the Iberian Peninsula is shown below.
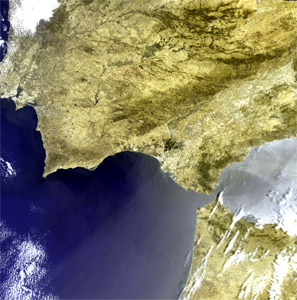
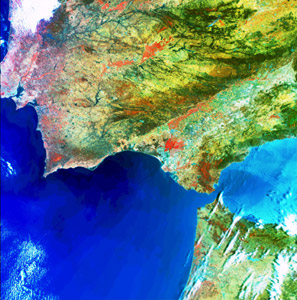
Below
is an example of designing a picture using a correction,
for which channel 13, which is close to the infra-red, is used.
The picture is lighter and the vegetation is more green.
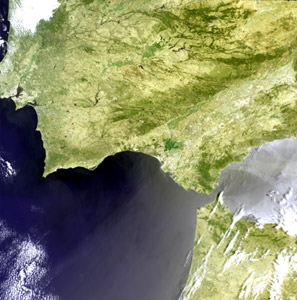
The
same when "histogram equalizing methode" is used.
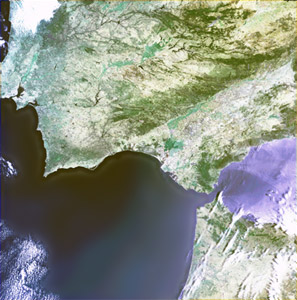
A
picture designed on the basis of the simple method (based on
3 channels)
referred to at the beginning of this description.
Pictures made by photographic cameras from Space
from different heights under different conditions:

image source: http://eol.jsc.nasa.gov/sseop/EFS/lores.pl?PHOTO=STS039-151-193A

image source: http://eol.jsc.nasa.gov/sseop/EFS/lores.pl?PHOTO=STS059-238-74


image source: http://eol.jsc.nasa.gov/scripts/sseop/changepage.pl
Finally,
an image designed from several pictures using Photoshop.
This web-site presents mostly images designed using this manual method.
© M.Paperin, Brockmann Consult GmbH, - October, 2003