Glaciers of northern Greenland
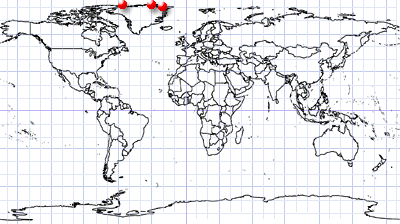
Northern edge of Greenland
Dates of acquisition:
- August 2nd, 2024 | 19:10:30 UTC
- August 2nd, 2024 | 19:10:30 UTC
- August 3rd, 2024 | 20:19:05 UTC
- August 1st, 2024 | 17:09:32 UTC
- August 2nd, 2024 | 18:19:28 UTC
- August 11th, 2024
Sensor: Sentinel-2 L2A
Coordinates: See table in text
Along the edges of the Greenland Ice Sheet, where the land is mostly ice-free in summer, there are many small, isolated glaciers. We couldn’t find the names of these glaciers, we’re not even sure if they have any, so we’ve listed them by location.
A glacier is a mass of ice that flows slowly, under the influence of gravity, from the highest point of the glacier to its edge. Glaciers are formed by large amounts of precipitation – mainly snow. Within the glacier body, the snow is transformed into firn (a densely packed, granular and recrystallized, perennial intermediate stage between snow and ice), and then into ice. These transformations occur through an increase in the density of the snow, caused by the pressure of the overlying mass, or by its melting with repeated freezing of the meltwater in the mass. The shape of the glacier is determined by the landscape in which it is located.
If the glacier is large enough, the summer temperature rise is not sufficient to melt the snow on its surface, because a large “cold reserve” in the glacier body prevents the snow from melting. If the glacier is relatively small, the snow on its surface melts, and its icy (often uneven) surface is exposed, providing an excellent opportunity to study its structure and even its evolutionary history.
Let’s take a closer look at the surface of the glacier, here called “Nyeboe Land W” (Figure 1). We can clearly recognize ice flow lines and dark and light isolines of varying thickness. Each isoline most likely represents a layer of ice formed over one short, continuous period (from a few months to a few years). The dark colour may indicate the presence of dust, and/or dirt, and solids other than ice in the ice layers that fell with the snow and hence an increased content of aerosols in the atmosphere during this period.
The angles of the flow lines to the isolines are equal to or close to 90°, which could confirm the assumption about the ice layers.
In summer, in mid/late July / early August, the ice of the glacier melts from below. At the same time, the snow and ice on the surface melt unevenly. The surface of the glacier is therefore uneven. This is why the isolines take the form of circles, ovals and meandering, closed lines that show the positions of the layers, which are all roughly at the same level in height.
Observations of the layers and comparison between different glaciers can help to establish an approximate chronostratigraphy of the ice layers and a historical line of aerosol content in the atmosphere over hundreds, thousands and even tens of thousands of years.
There are also 4 other beautiful images (Figures 2–5) of glaciers in different areas of north and northeast Greenland.
Table of figures and locations
| Image | Location | °N | °W | km* | km2 Δ |
| Figure 1 | Nyeboe Land W | 81.823° | 57.415° | 26 | 23 |
| Figure 2 | Nyeboe Land E | 81.855° | 55.513° | 16 | 11 |
| Figure 3 | J.C. Christensens Land | 81.466° | 30.122° | 150 | 425 |
| Figure 4 | Crown Prince Christian Land | 80.696° | 21.603 | 145 | 605 |
| Figure 5 | Peary land NW | 82.707° | 28.929° | 40 | 30 |
| Figure 6 | Peary land SE | 82.645° | 28.311° | 37 | 29 |
| Figure 7 | Nyeboe Land E | 81.929° | 55.912° | 3.5 | 0.9 |
| Header image | Nyeboe Land E | 81.805° | 55.700° | 42 | 36 |
* length around the perimeter [km] (approximately)
Δ area [km2] (approximately)
By the end of August, the surface begins to be covered with snow again and winter quickly sets in (Figure 6).
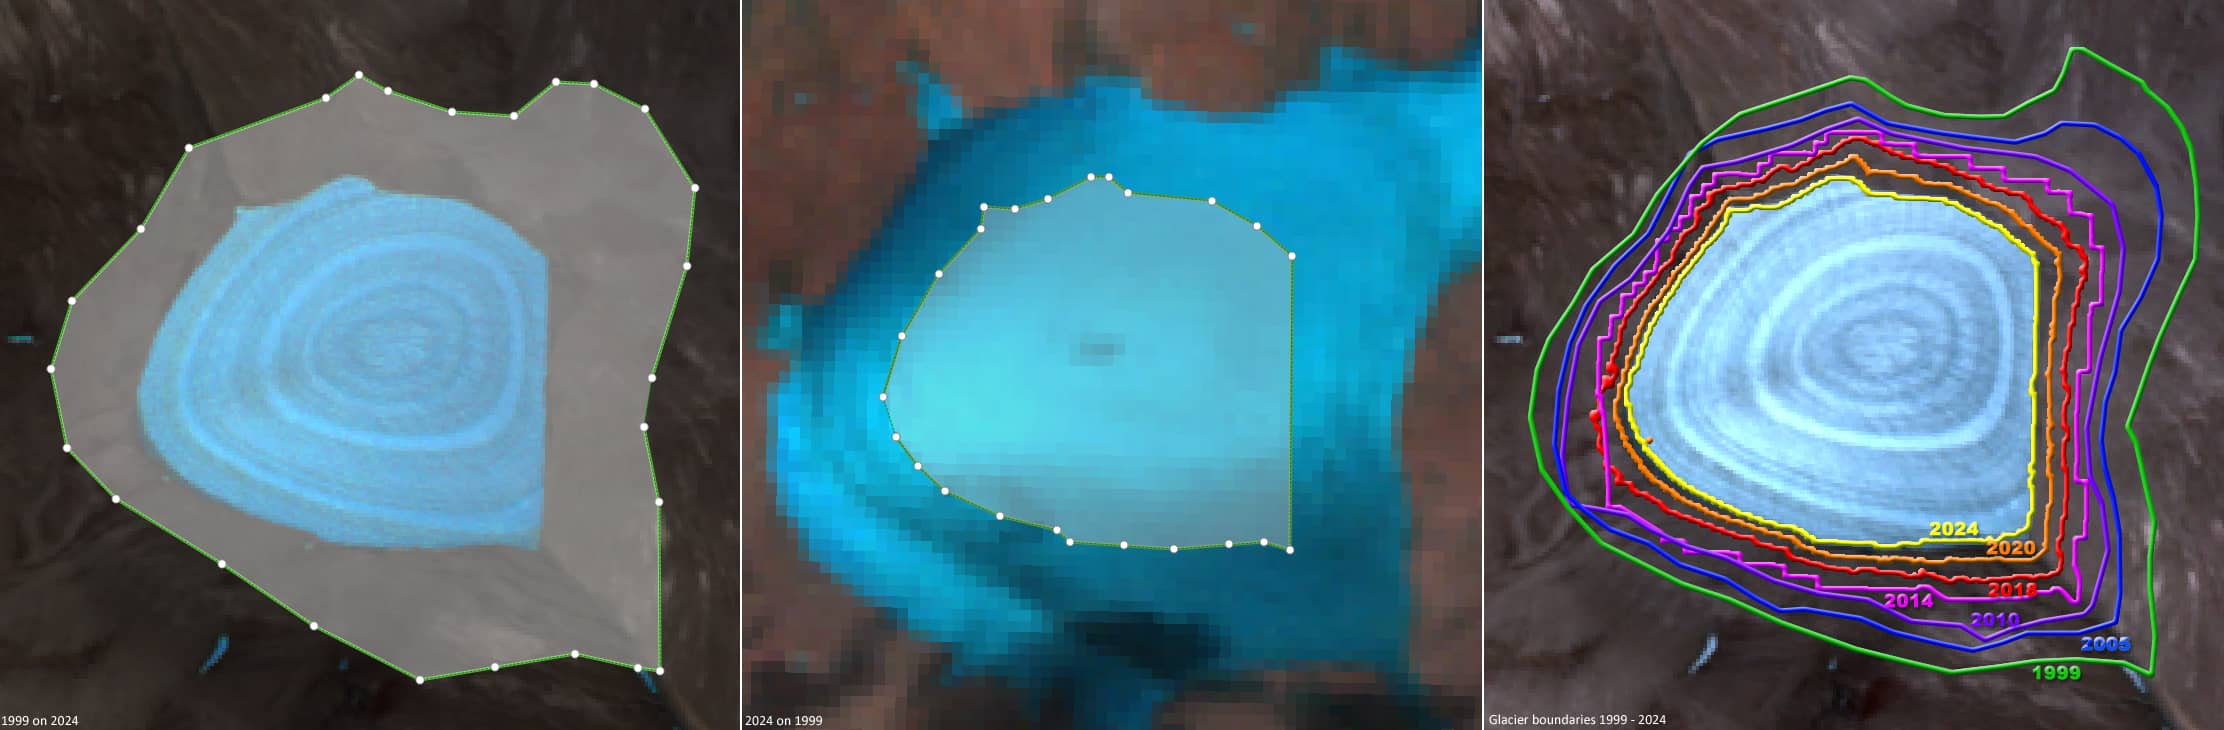
To illustrate that glaciers change in size, consider the example of a small glacier in eastern Nyeboe Land(81.929°N, 55.912°W, Figure 7). Small glaciers, which have the highest surface area to mass ratio, melt faster than larger glaciers and show more significant changes. This glacier (Figure 7) has now a surface area of about 0.9 km2. Probably due to global warming, it has shrunk from 2.1 km2 to its current size in the last 25 years.
Figure 8 shows a comparison of the size of the glacier in 1999 and 2024, and its changing approximate boundaries for different years during this period.
Fig. 1
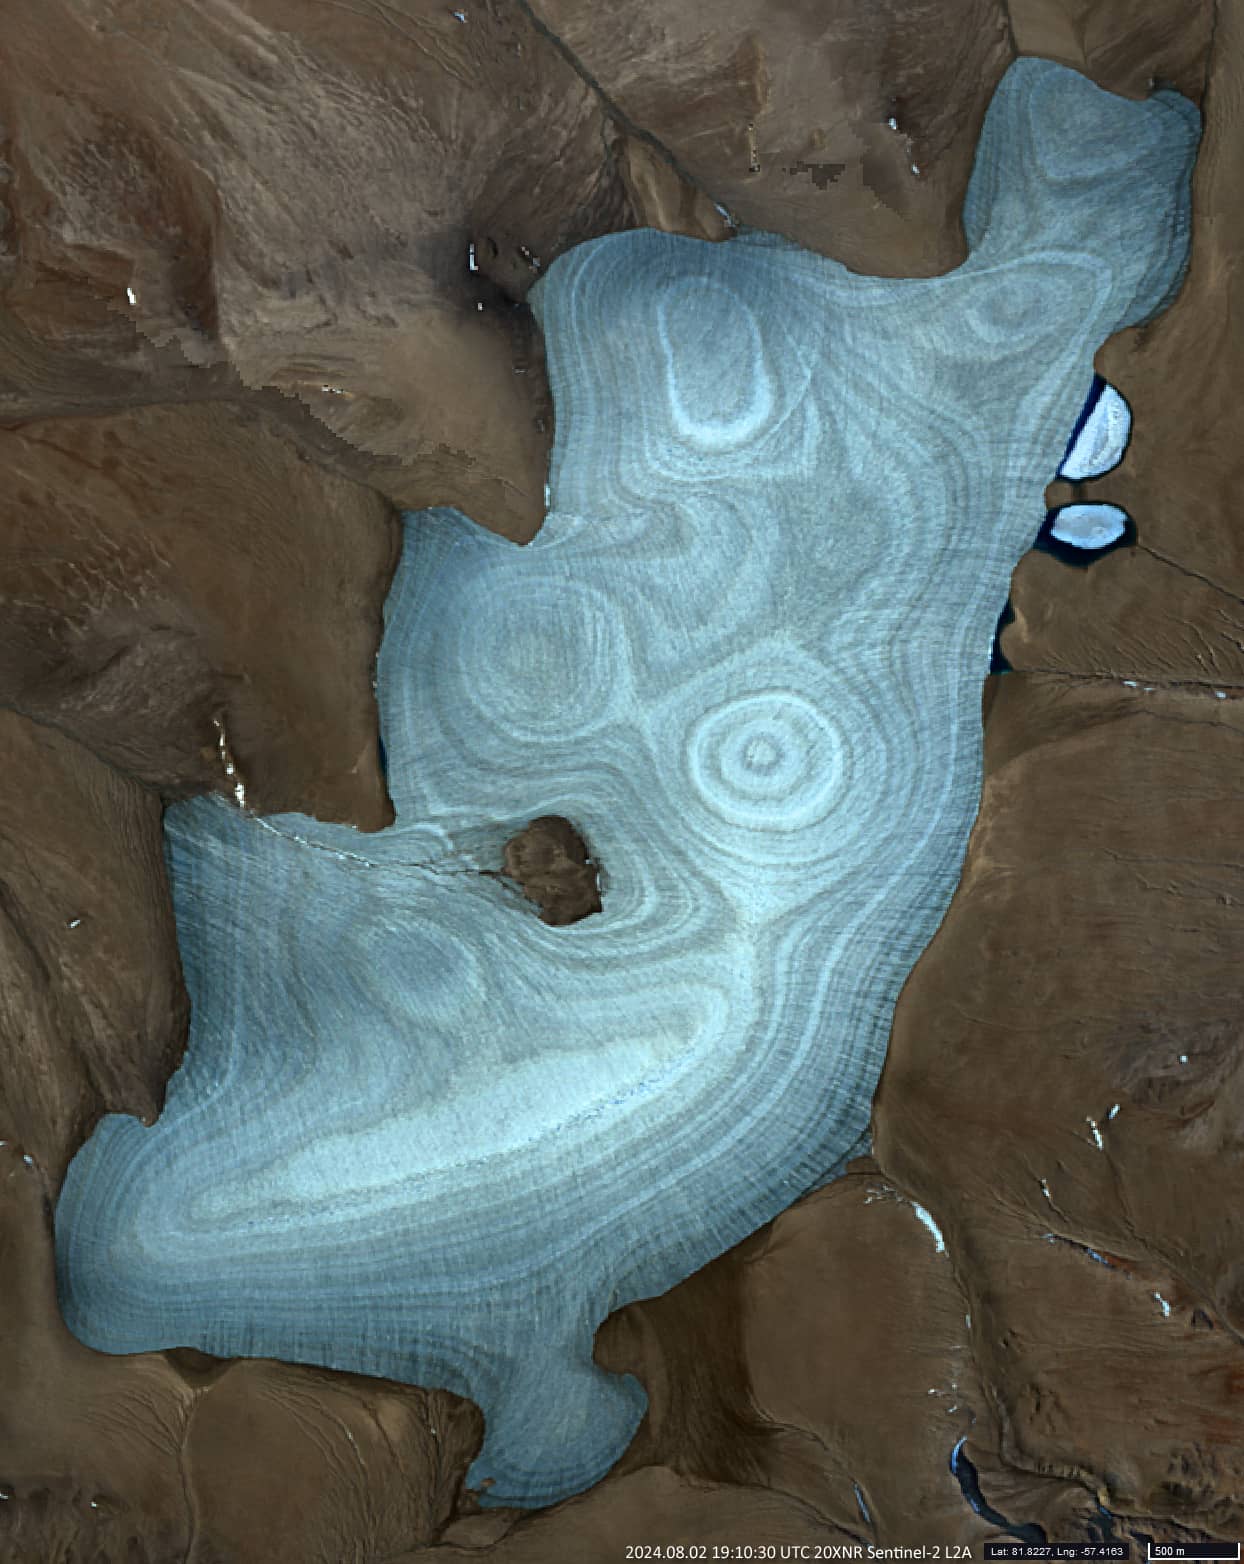
Fig. 2
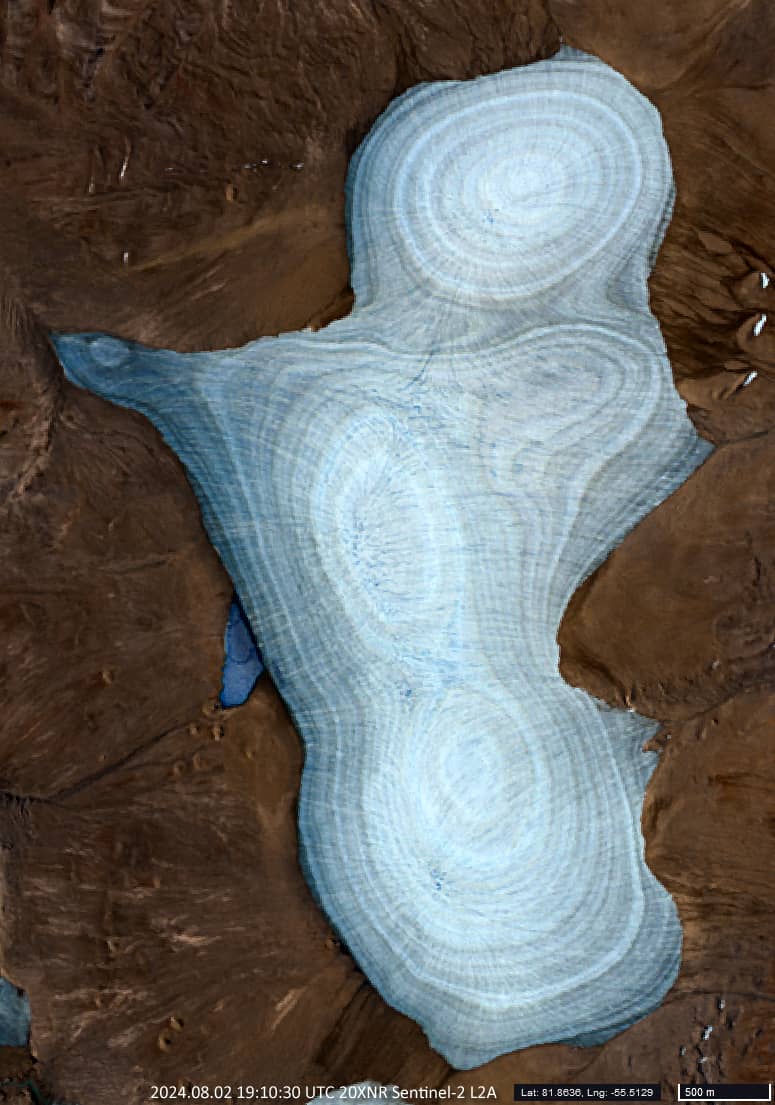
Fig. 3
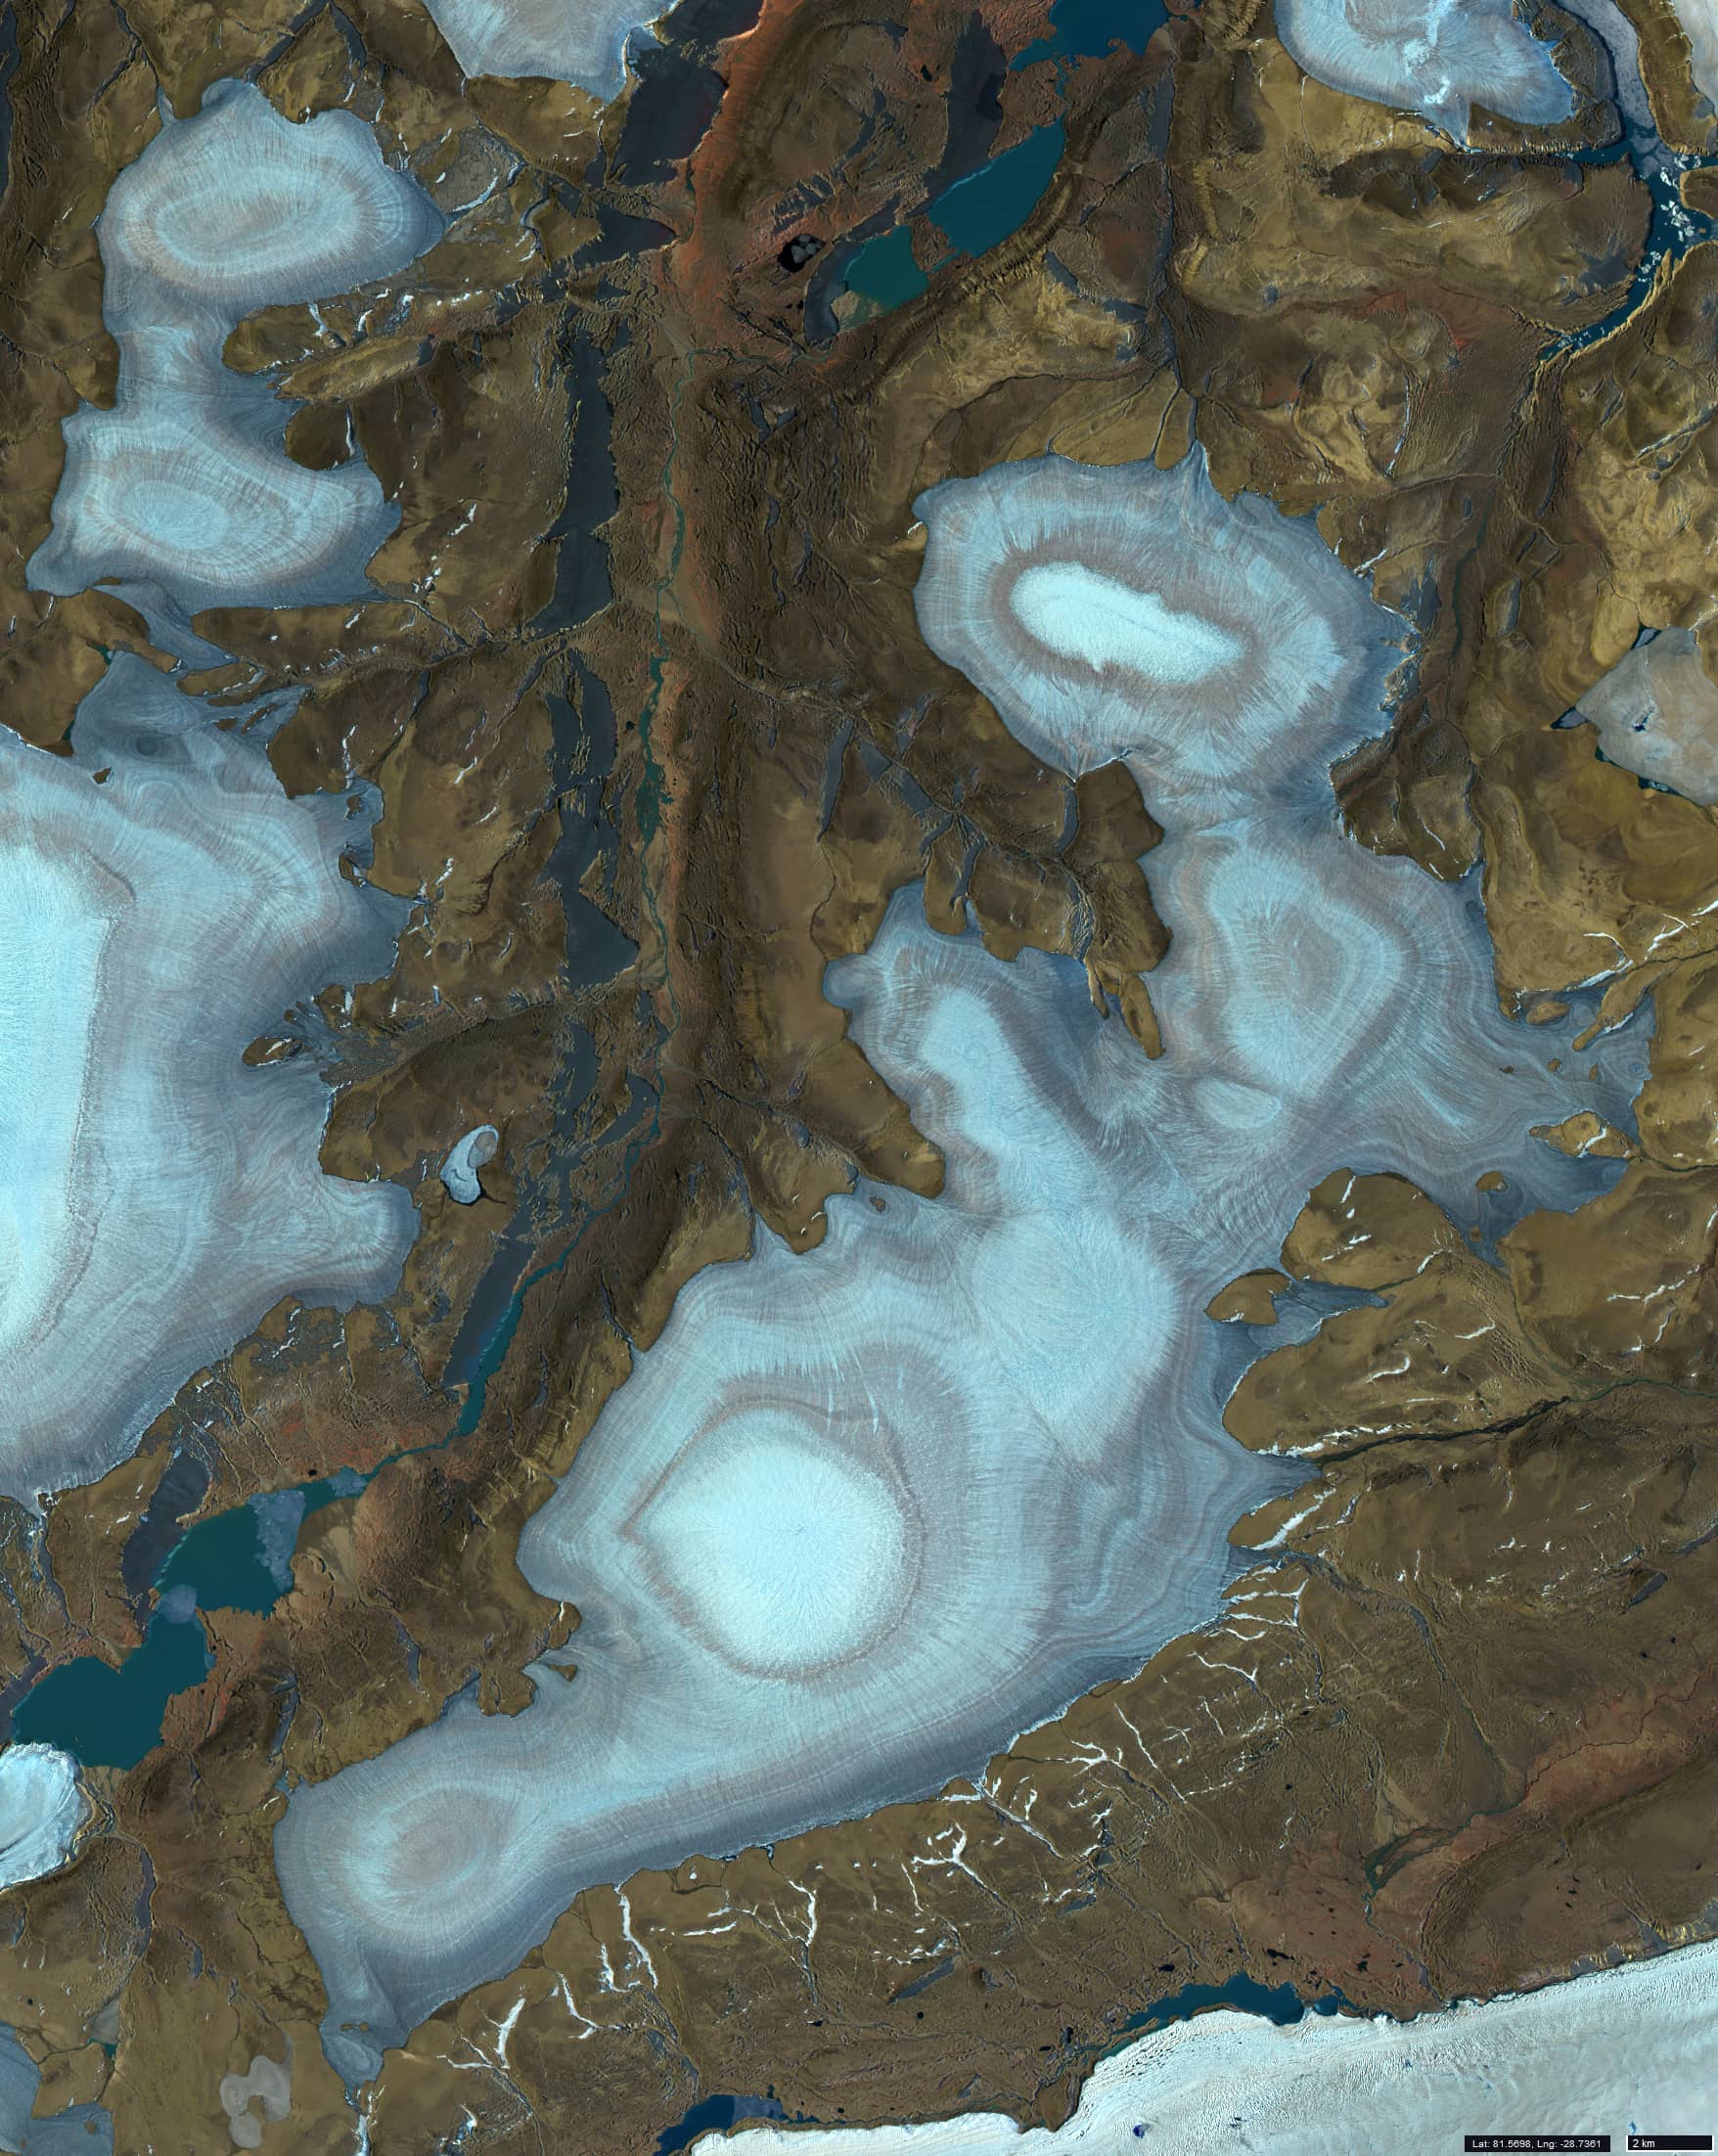
Fig. 4
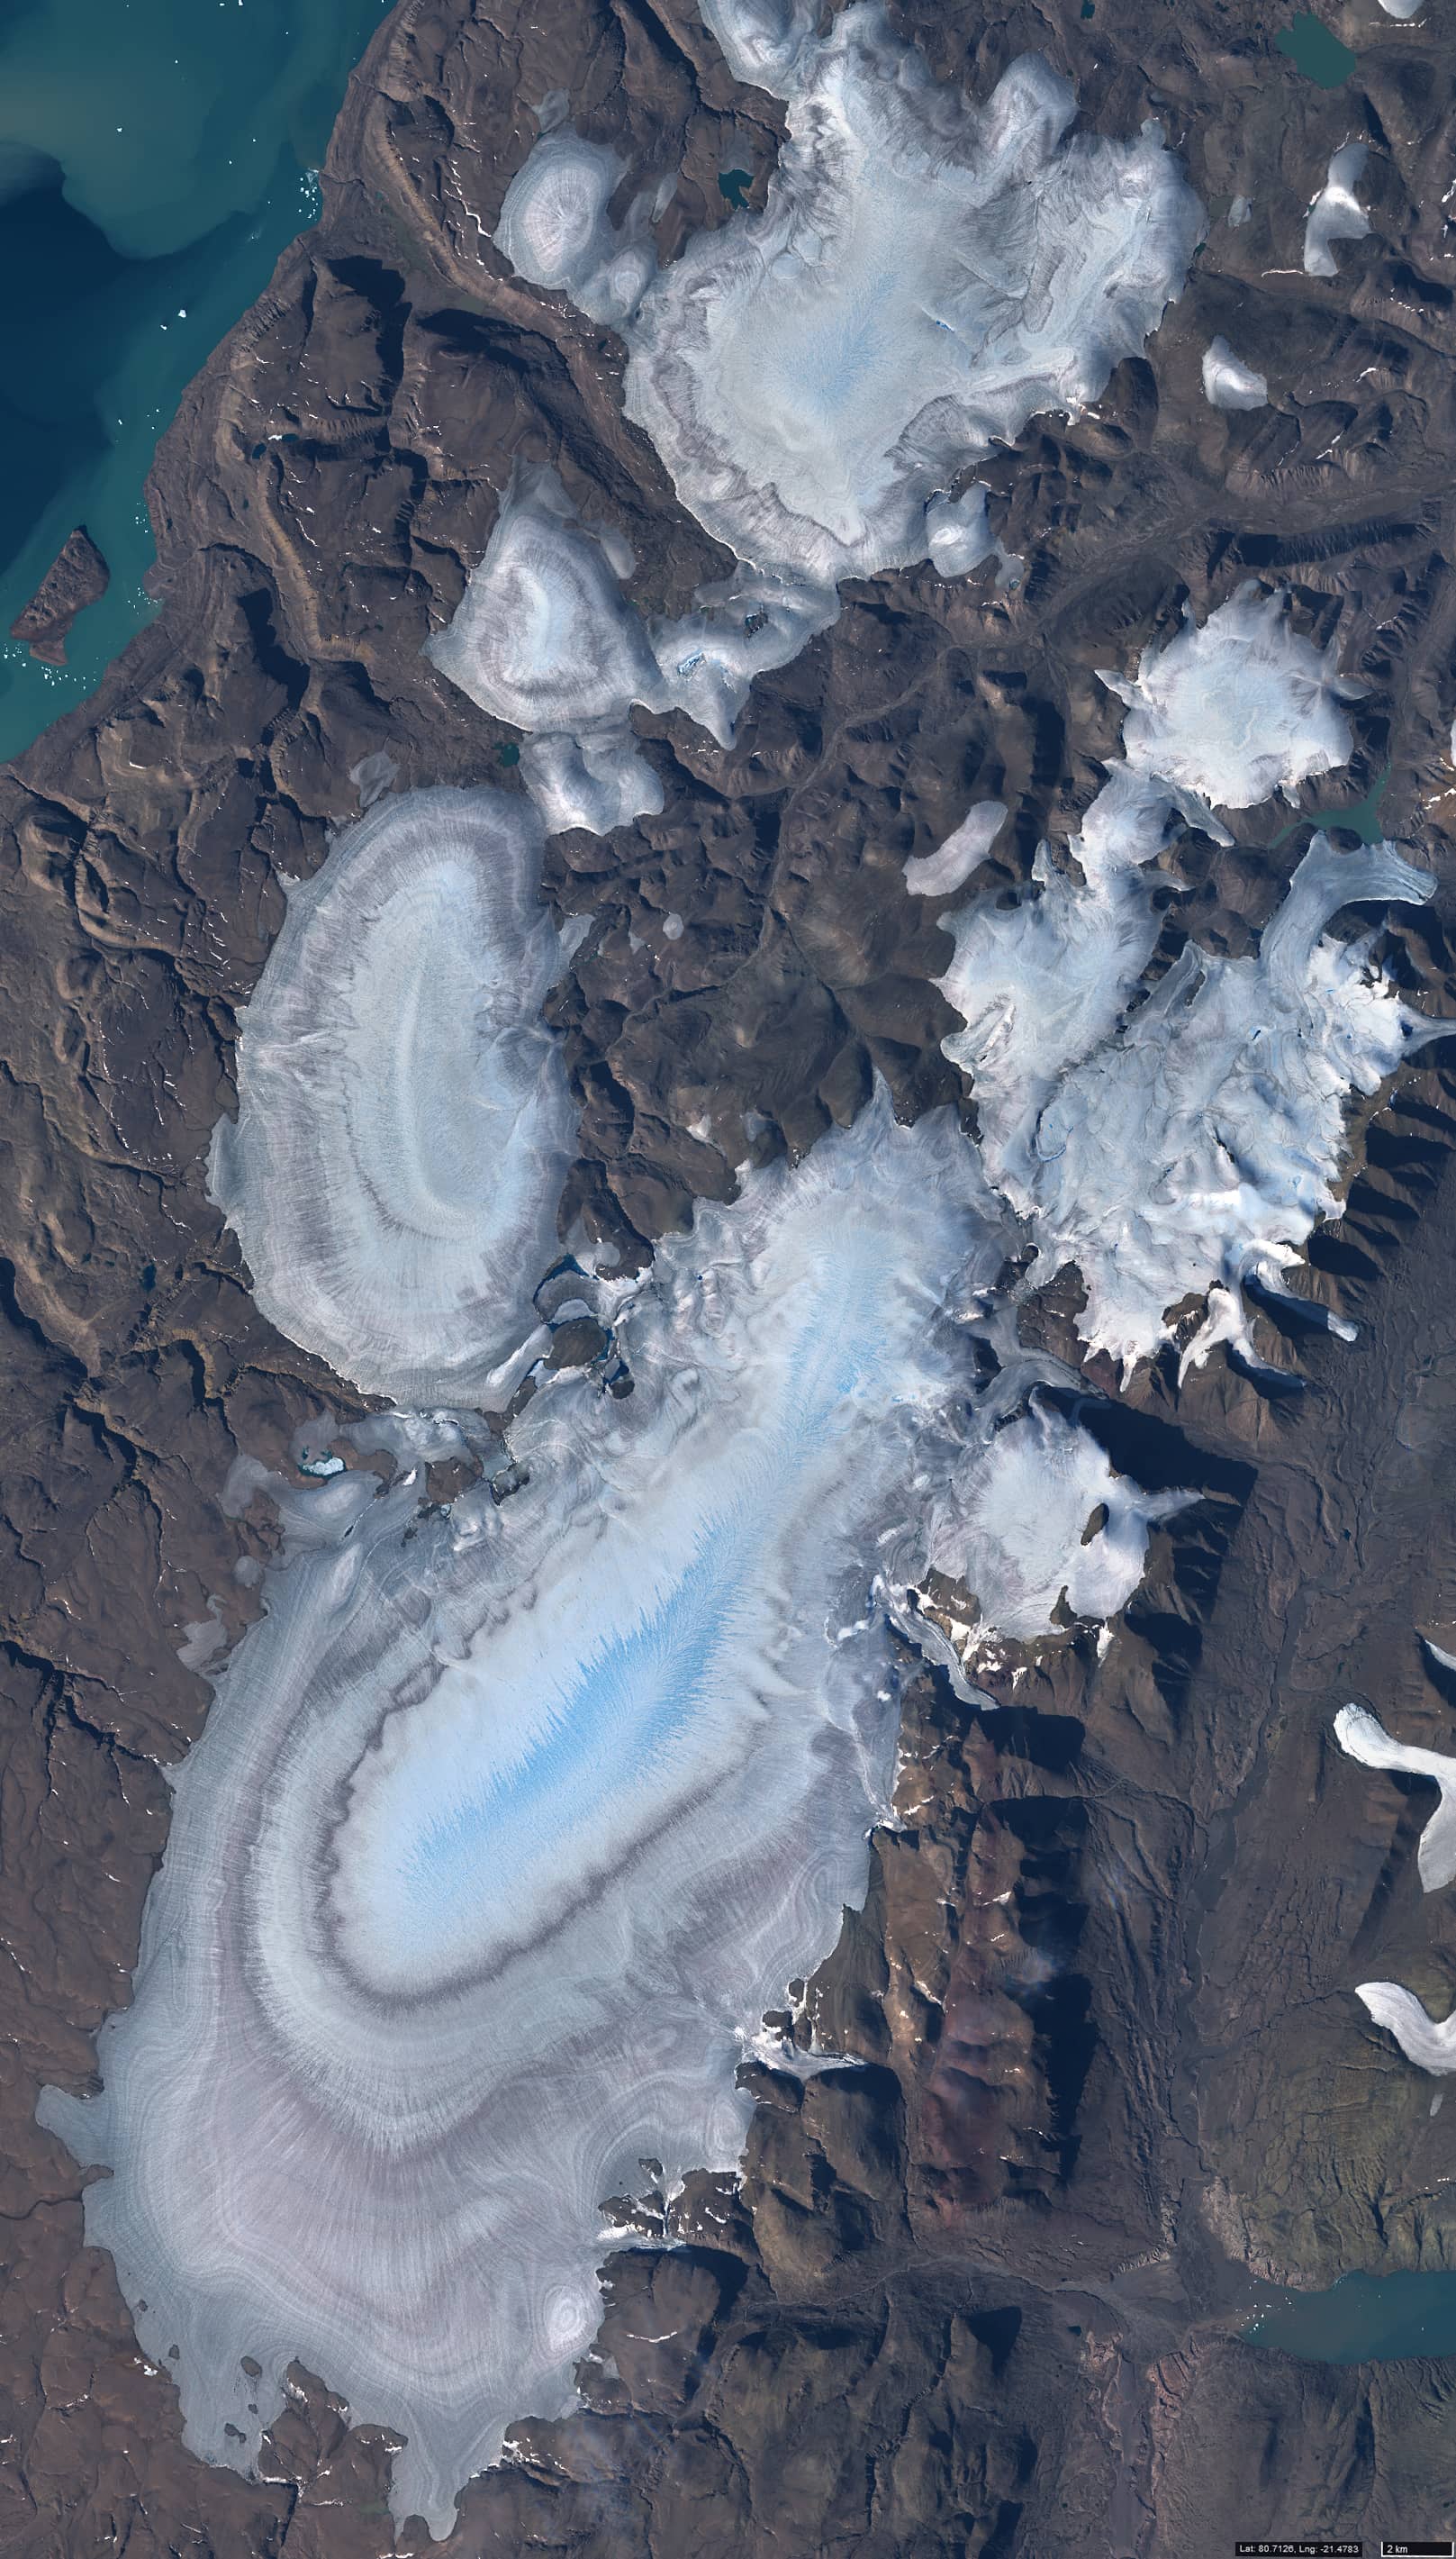
Fig. 5
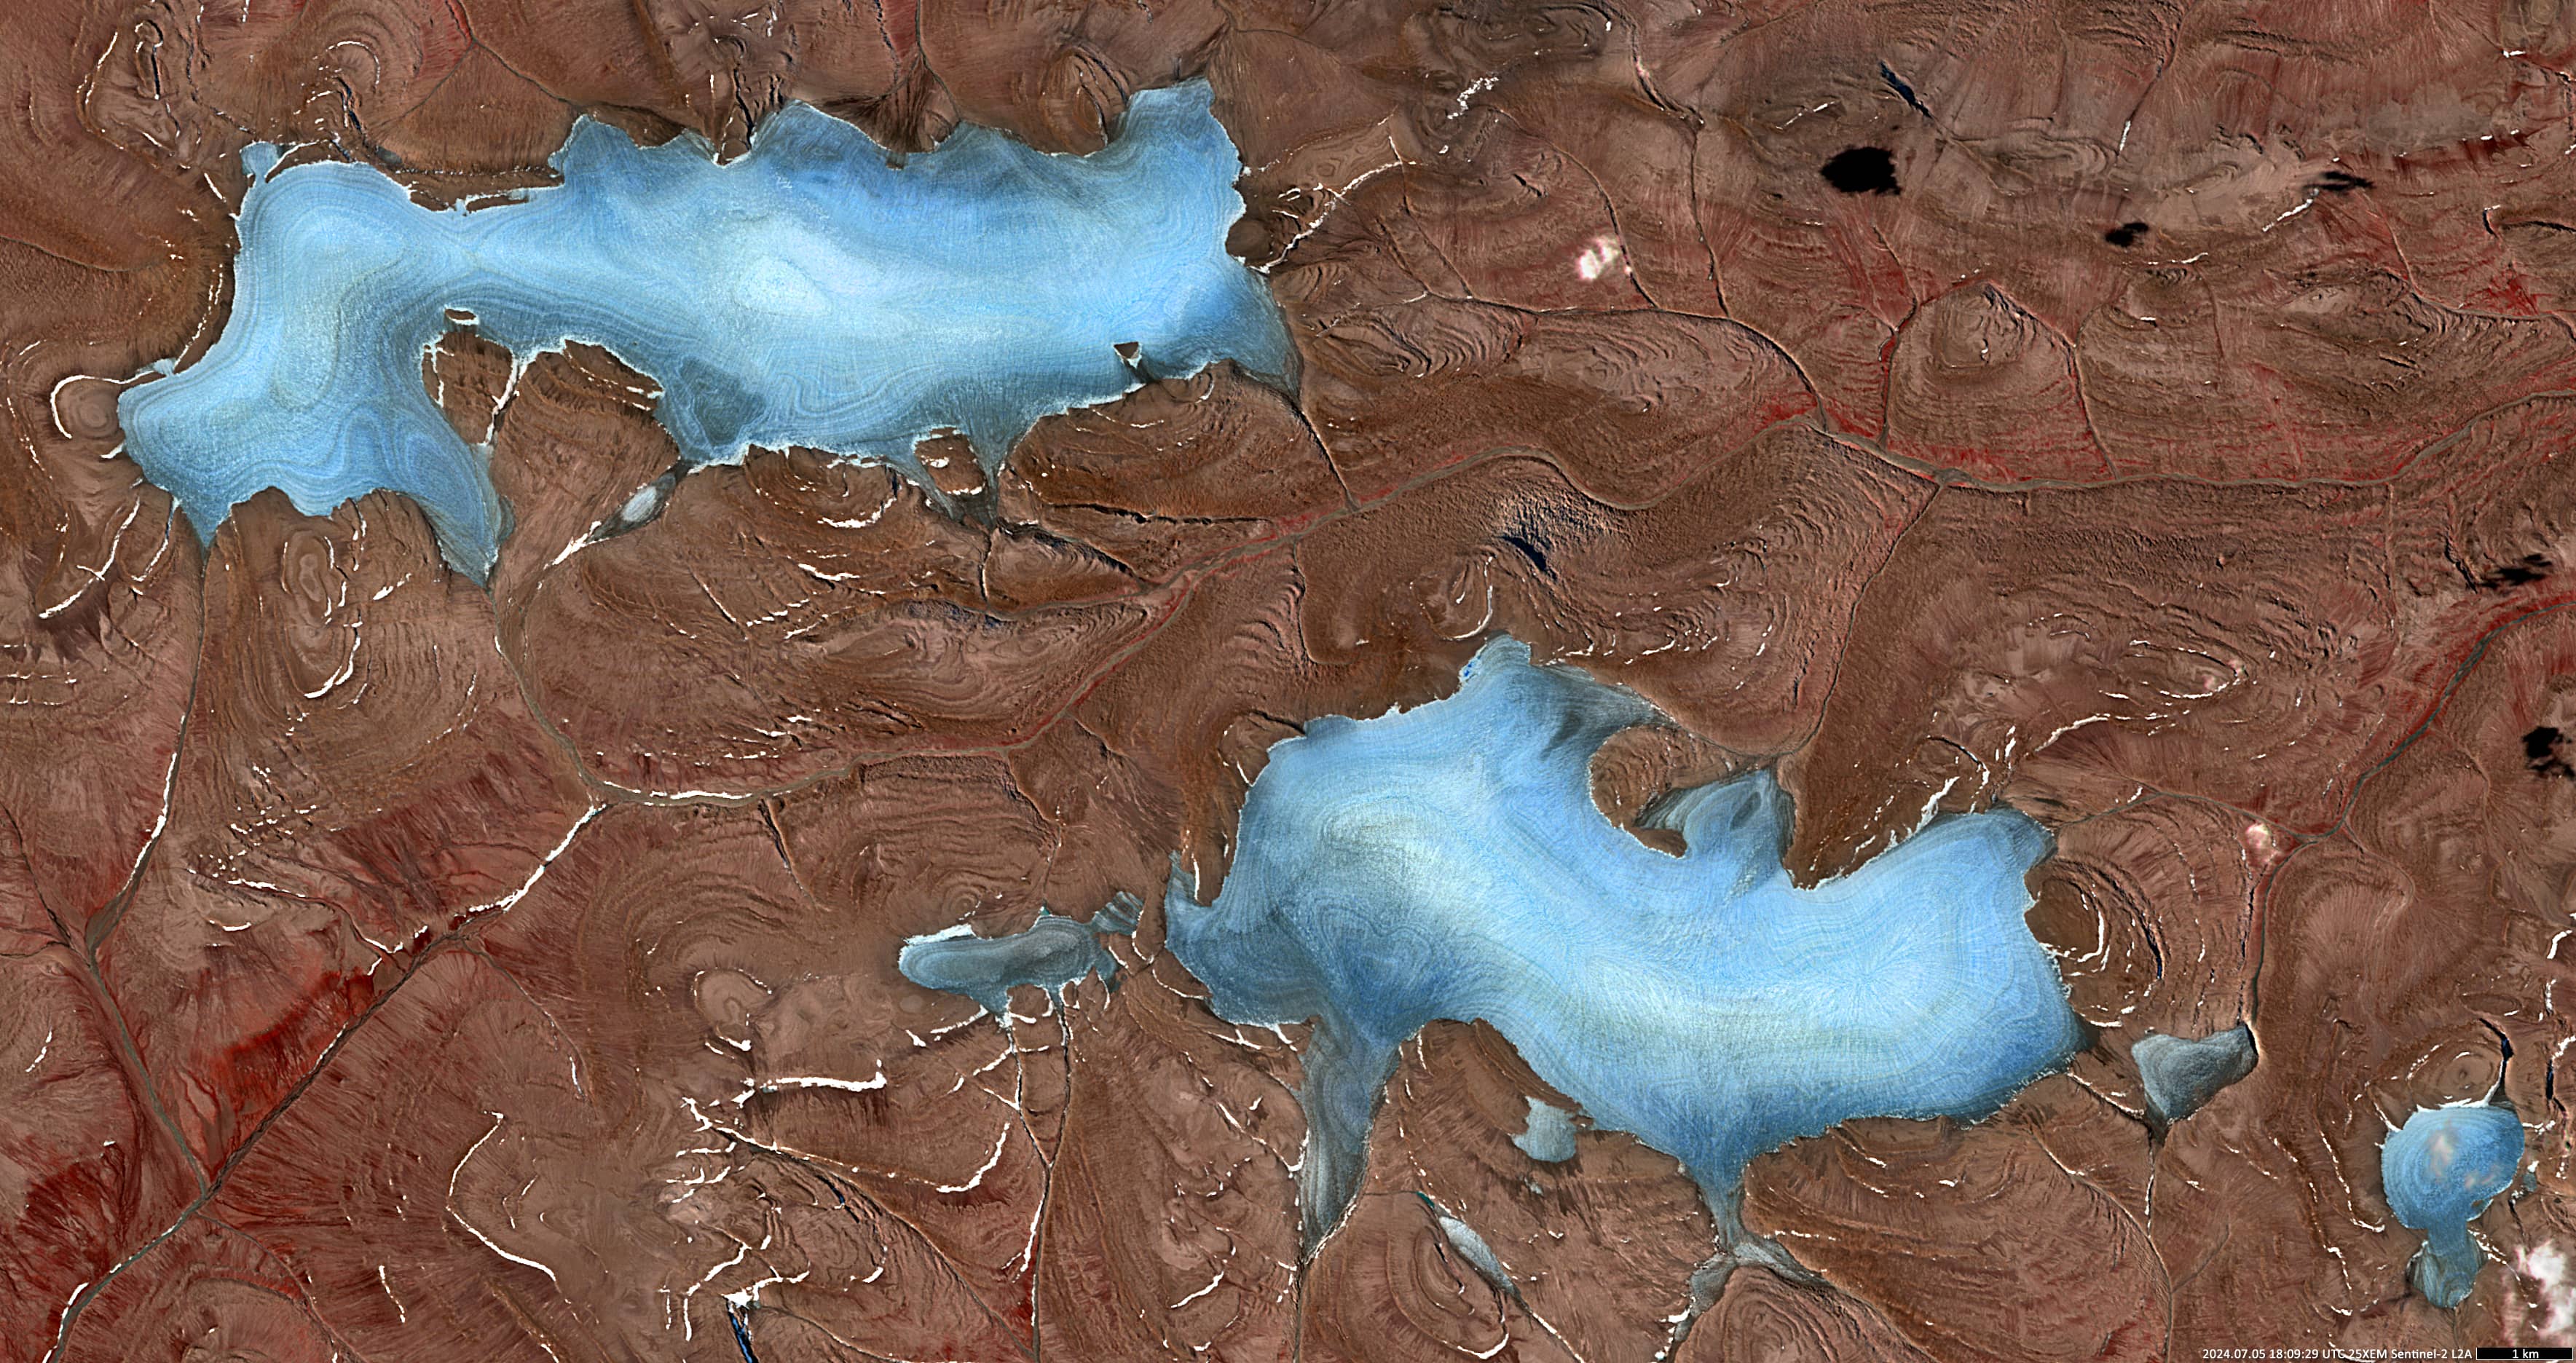
Fig. 6
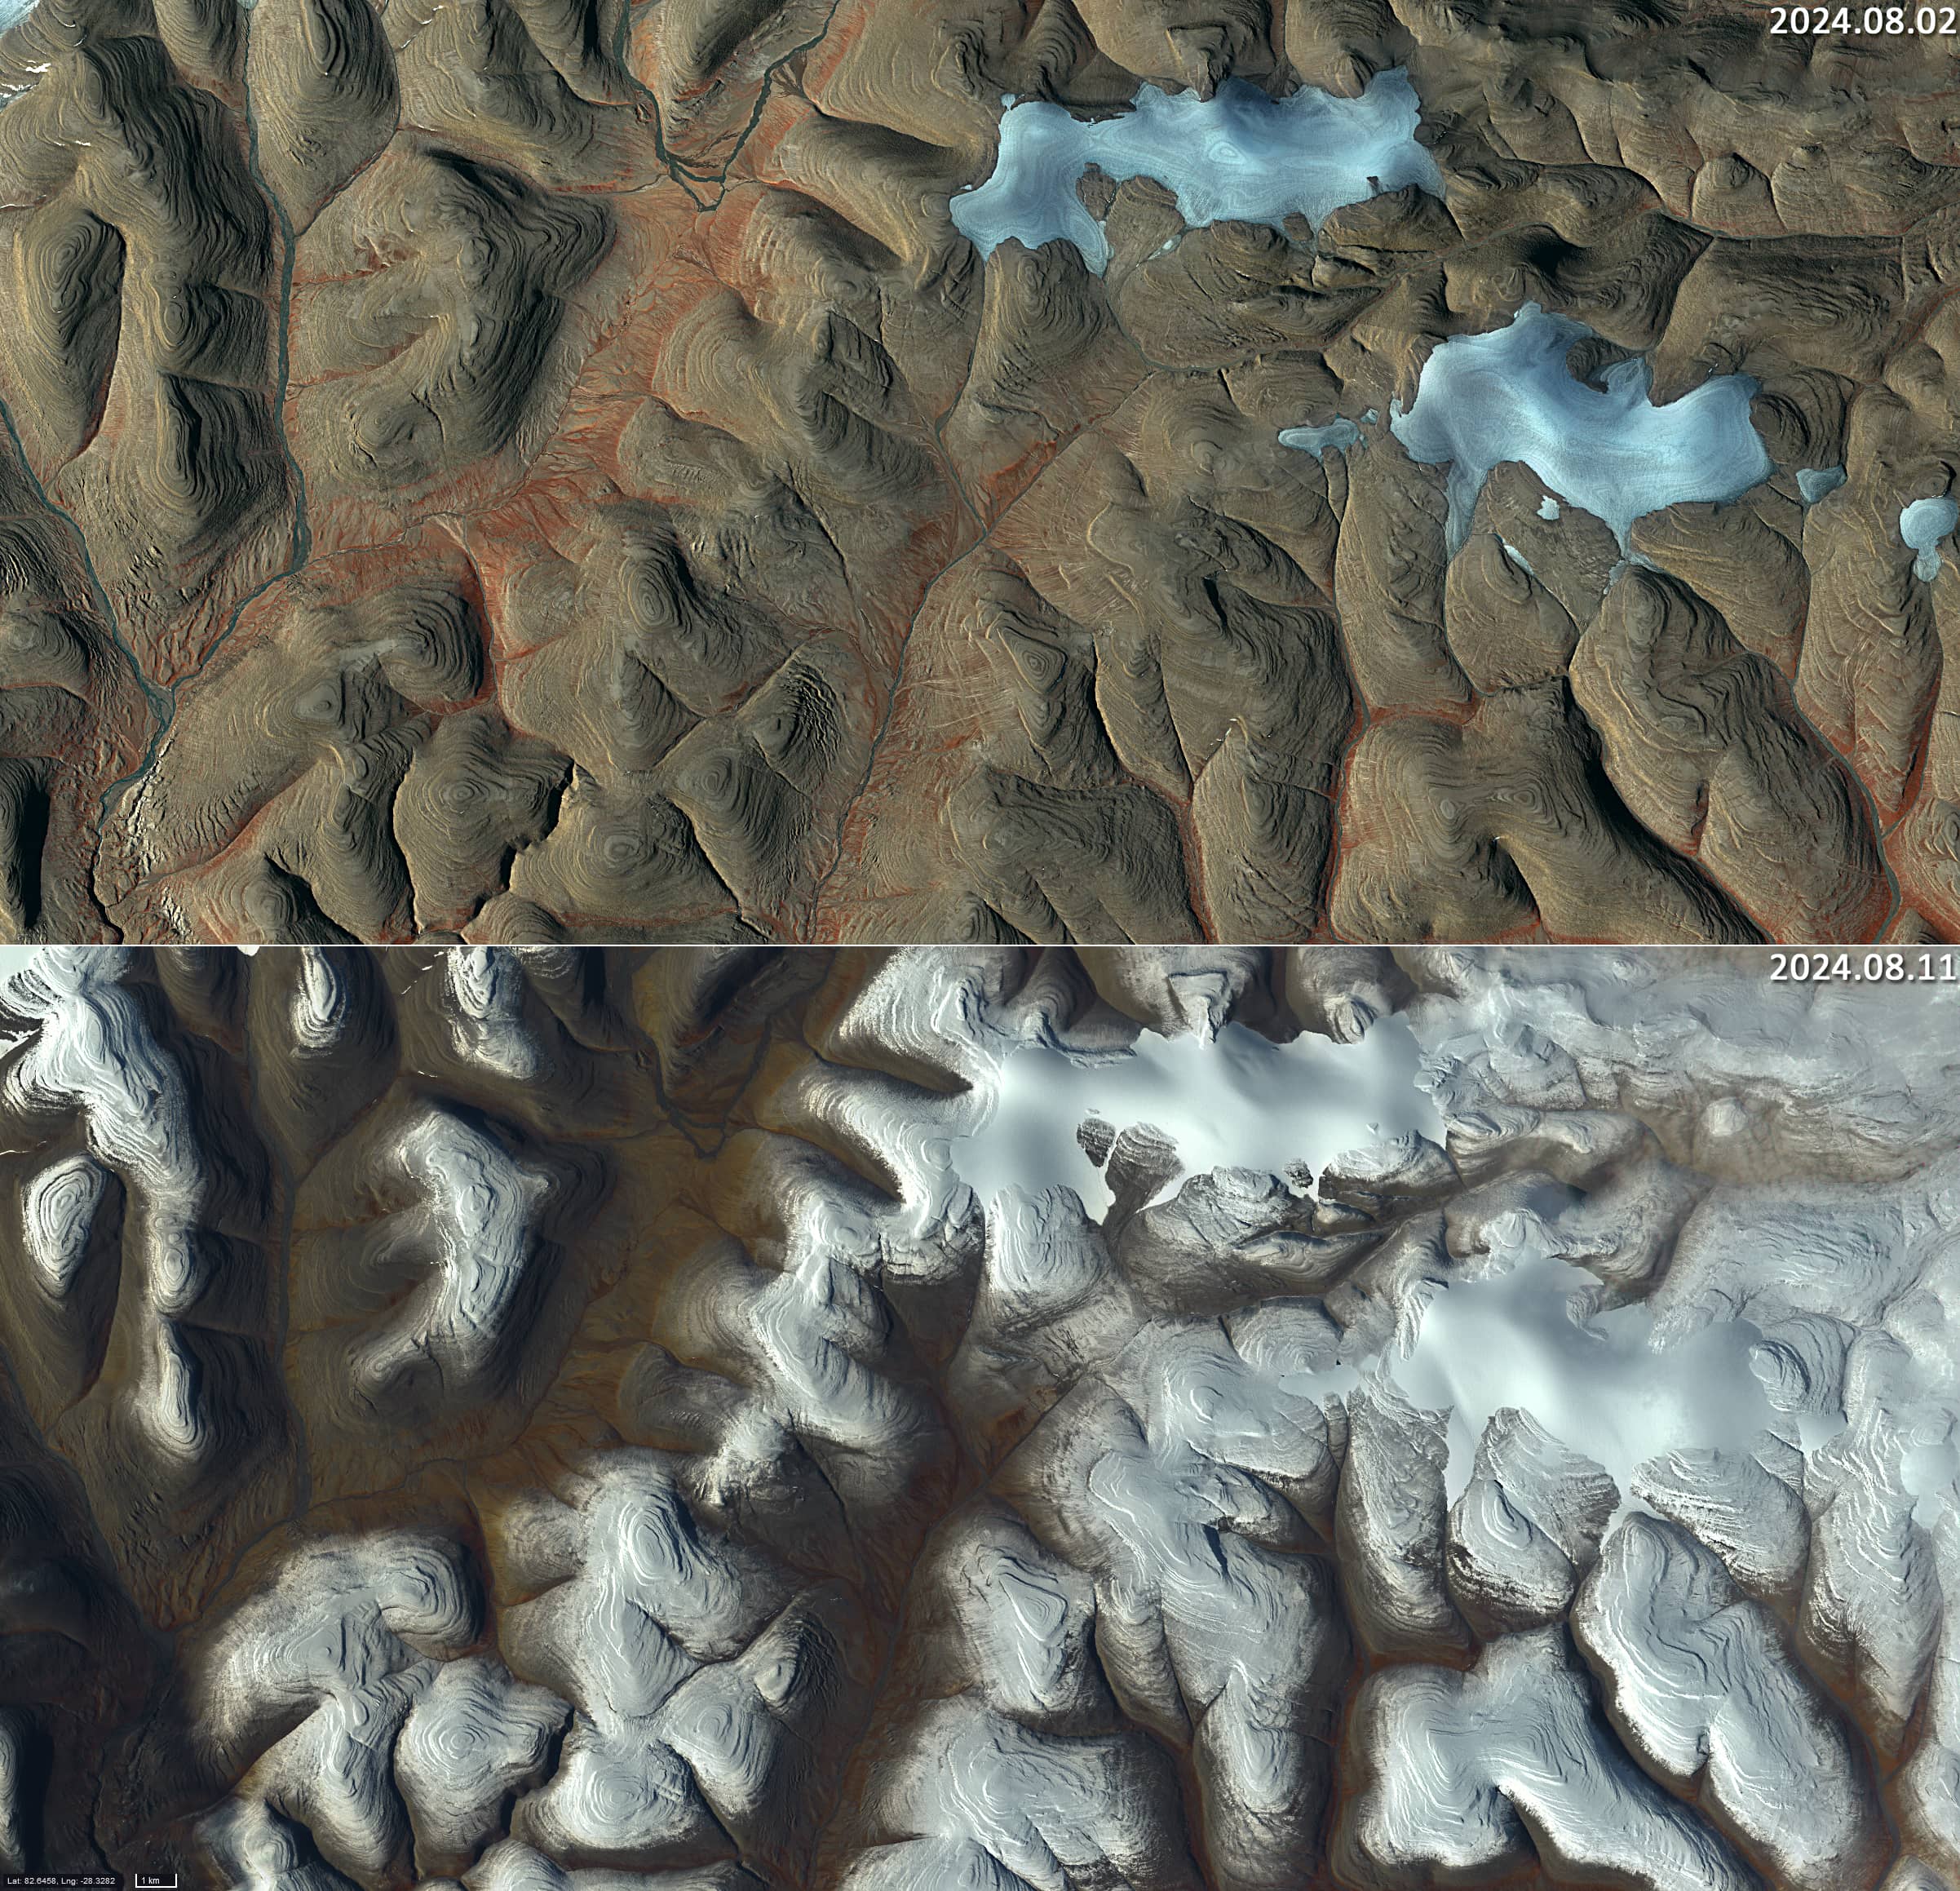
Fig. 7
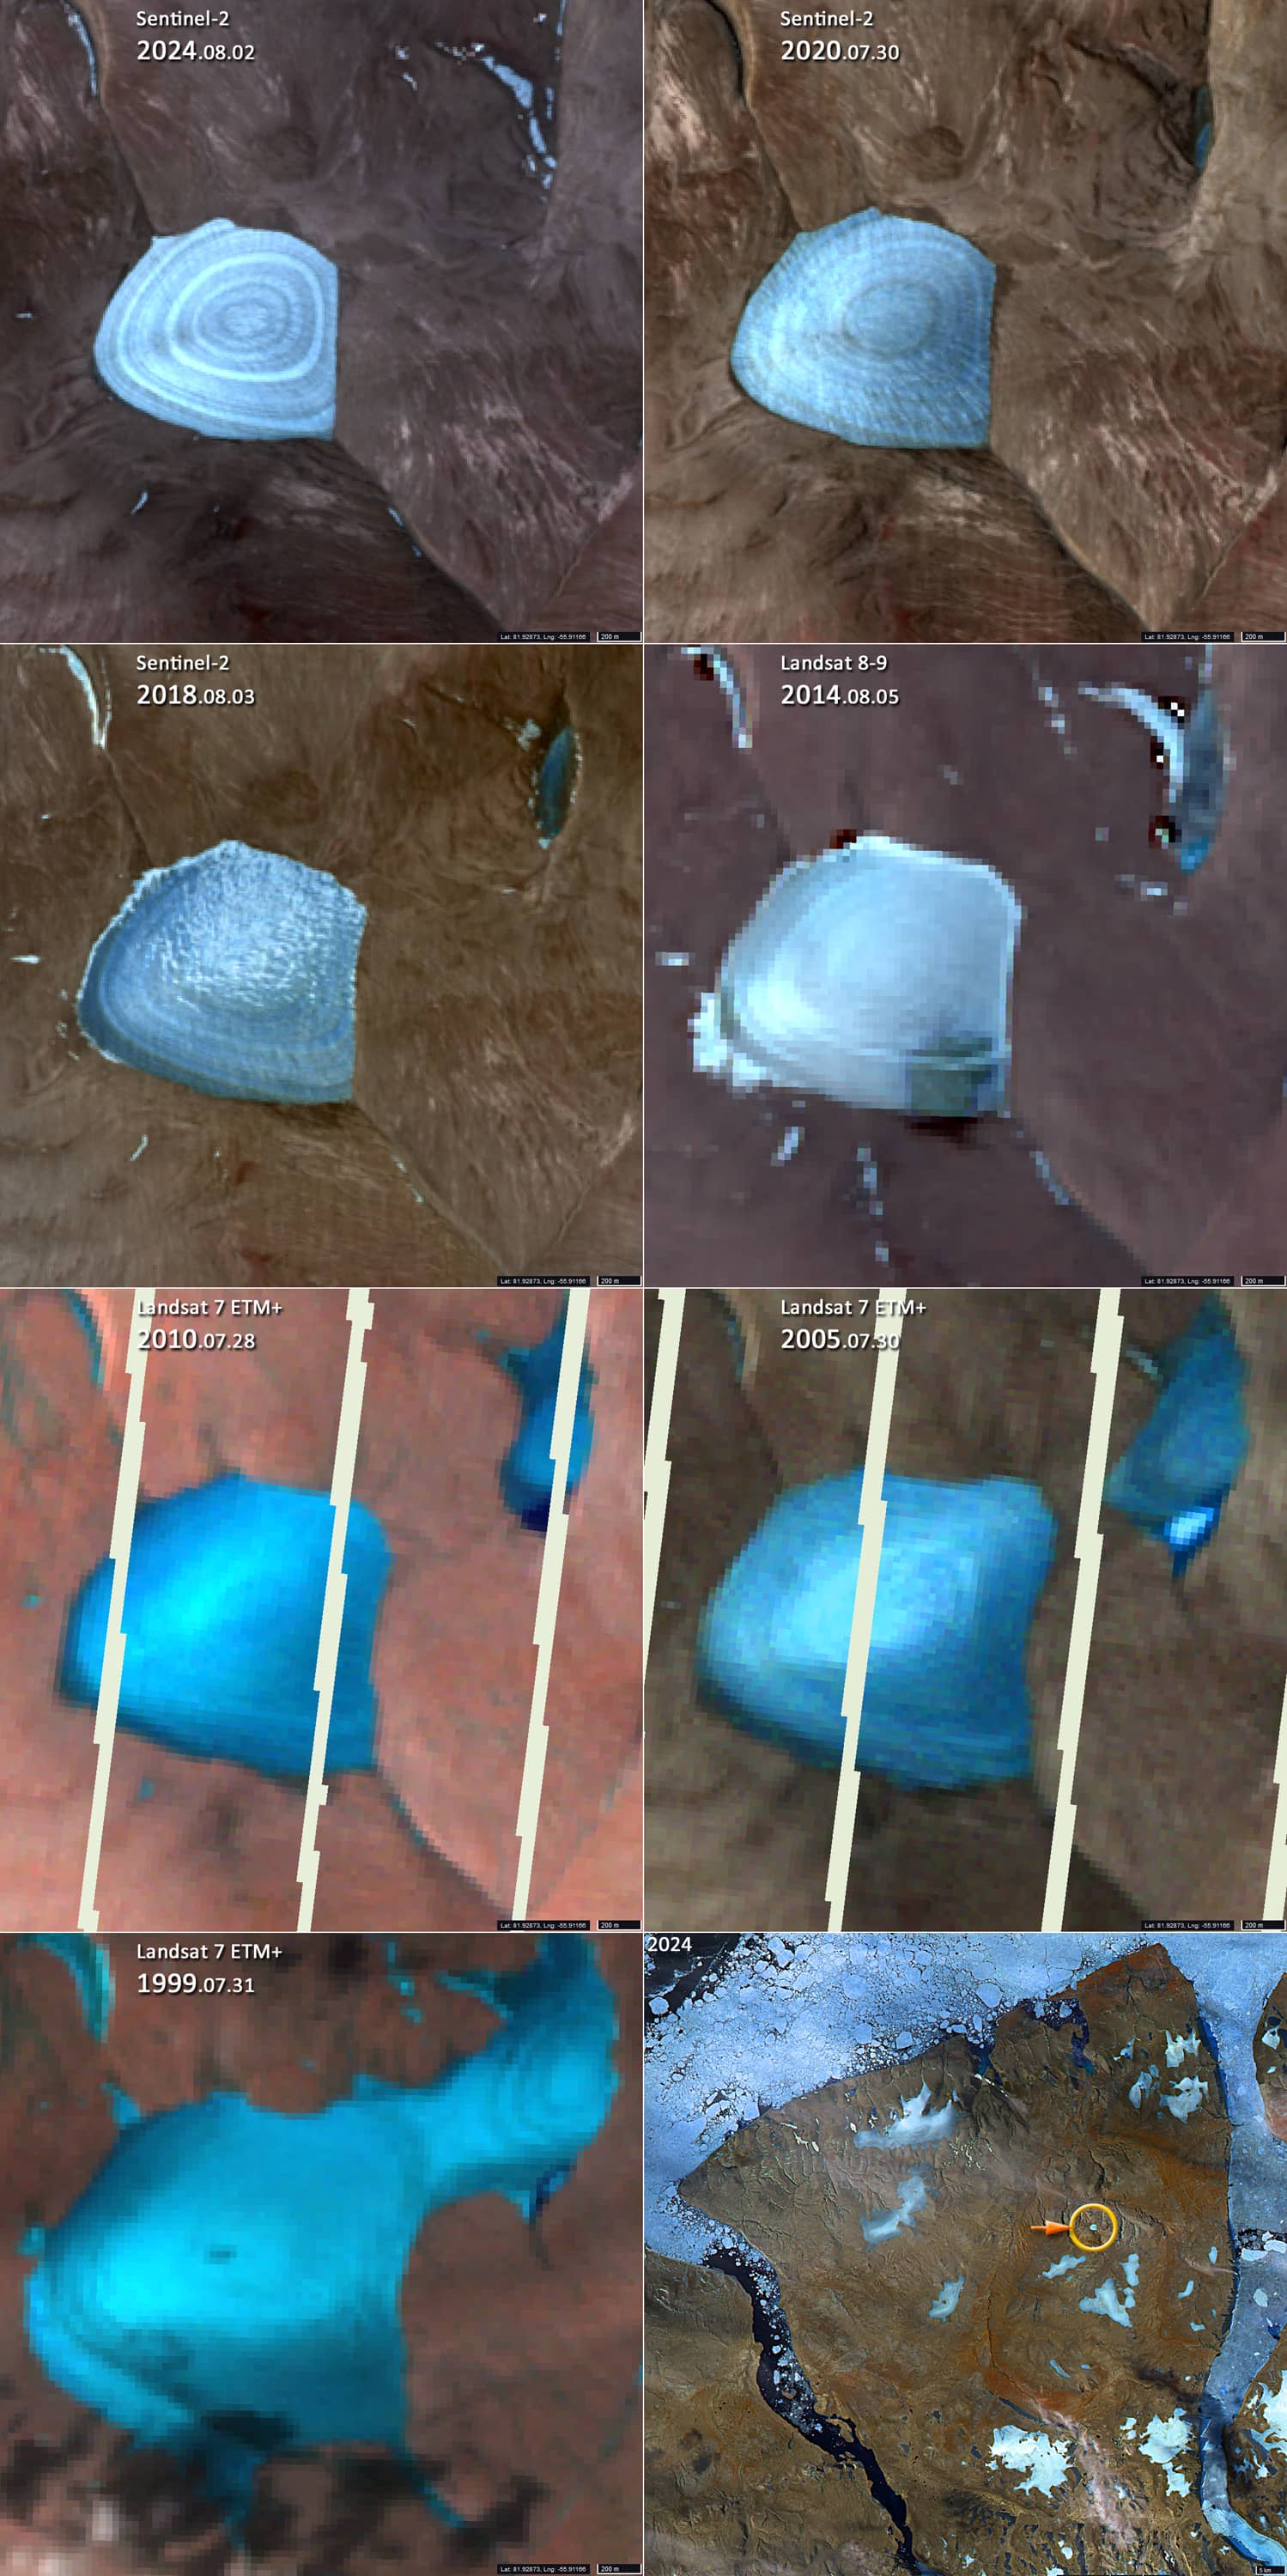
Fig. 8